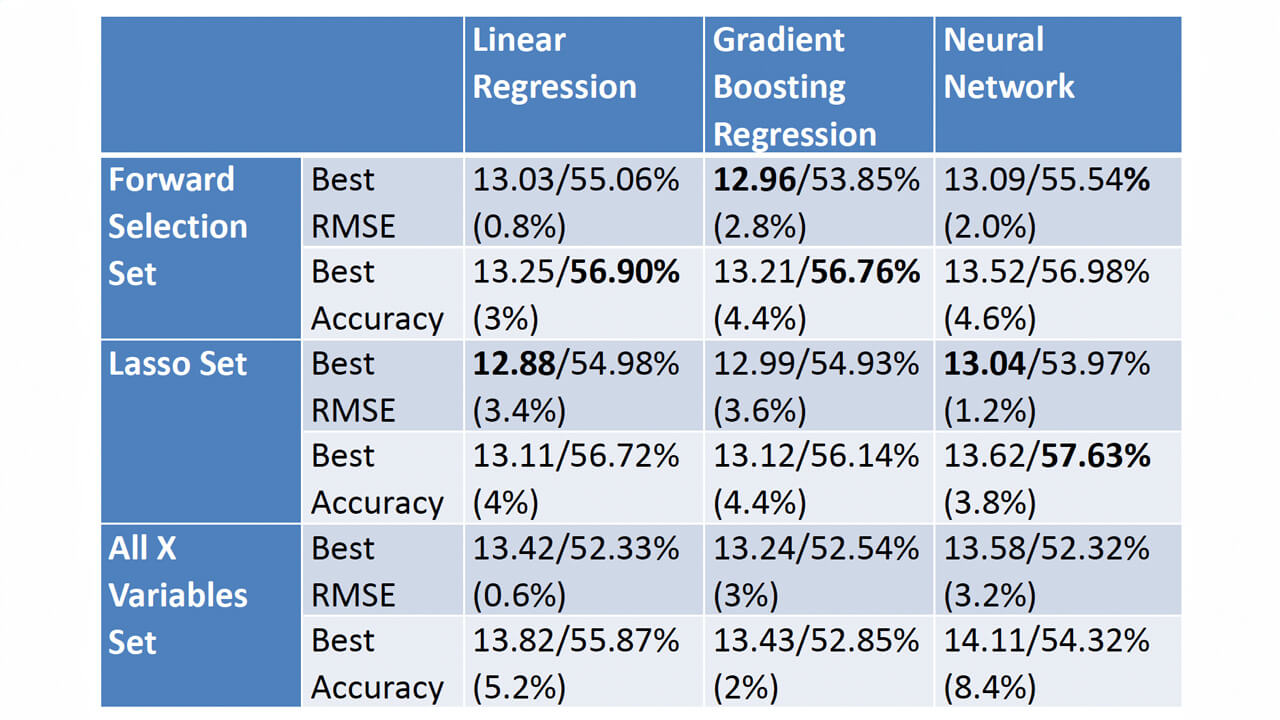
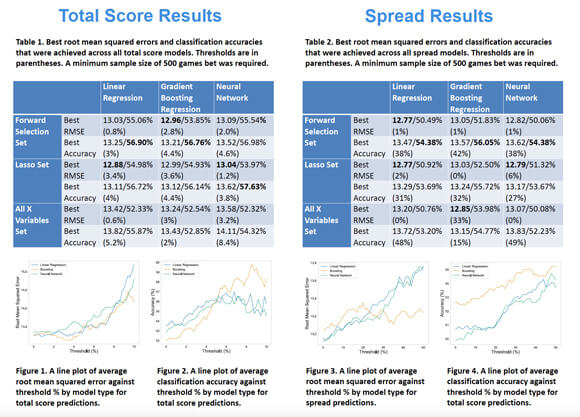
Table 1. Best root mean squared errors and classification accuracies that were achieved across all total score models. Thresholds are in parentheses. A minimum sample size of 500 games bet was required.
Data Science
Data Science
This project took on the challenge of developing machine learning models aimed at forecasting NFL game outcomes, specifically focusing on total scores and point spreads. Jacob Conrad ’24 utilized a dataset of NFL games spanning from 2018 to 2023, encompassing pre-game player projections, weather conditions, and stadium details. On this dataset, he employed various techniques including linear regression, gradient boosting regression and neural networks.
This study explores predictive factors like weather, player skill, and other factors to develop a robust betting strategy. By avoiding emotional biases in favor of data-driven approaches, this study seeks to provide bettors with tools to place profitable NFL sports bets.

Data Science
College of Arts & Sciences
NFL sports betting has grown into a significant market driven by online accessibility and promotion. As of 2003, it ranked as the 11th largest industry in the U.S., and NFL betting has since grown exponentially. By 2016, over $90 billion was wagered on NFL games, with the Super Bowl alone amassing $4.7 billion in bets. As states continue to legalize both online and in-person sports betting, the trajectory of this market appears poised for continued growth.
Some of the most popular bets sports bettors place are pre-game spread or total score bets. For a spread bet, you are betting on the point differential of the game. For example, a bet is placed on a team at -2.5, if they win by 3 or more points the bet wins, and vice versa. For a total score bet, bettors can choose to bet “over” or “under” a designated total amount of points scored in the game.
Additionally, sports bettors need to understand their payout. Notably, bettors face a vigorish, or commission, which necessitates a success rate of 52.38% to cover losses. Despite the market's apparent efficiency, research suggests that bettor tendencies, rather than team strengths, influence line setting.
However, most bettors struggle to profit due to emotional decision-making and the temptation of chasing losses. This study explores predictive factors like weather, player skill, and other factors to develop a robust betting strategy. By avoiding emotional biases in favor of data-driven approaches, this study seeks to provide bettors with tools to place profitable NFL sports bets.
These were all created in the Python statistical programming language. The linear regression model was created using the statsmodels package, the neural network was created using the TensorFlow package, and the rest of the models were created using the sklearn package.
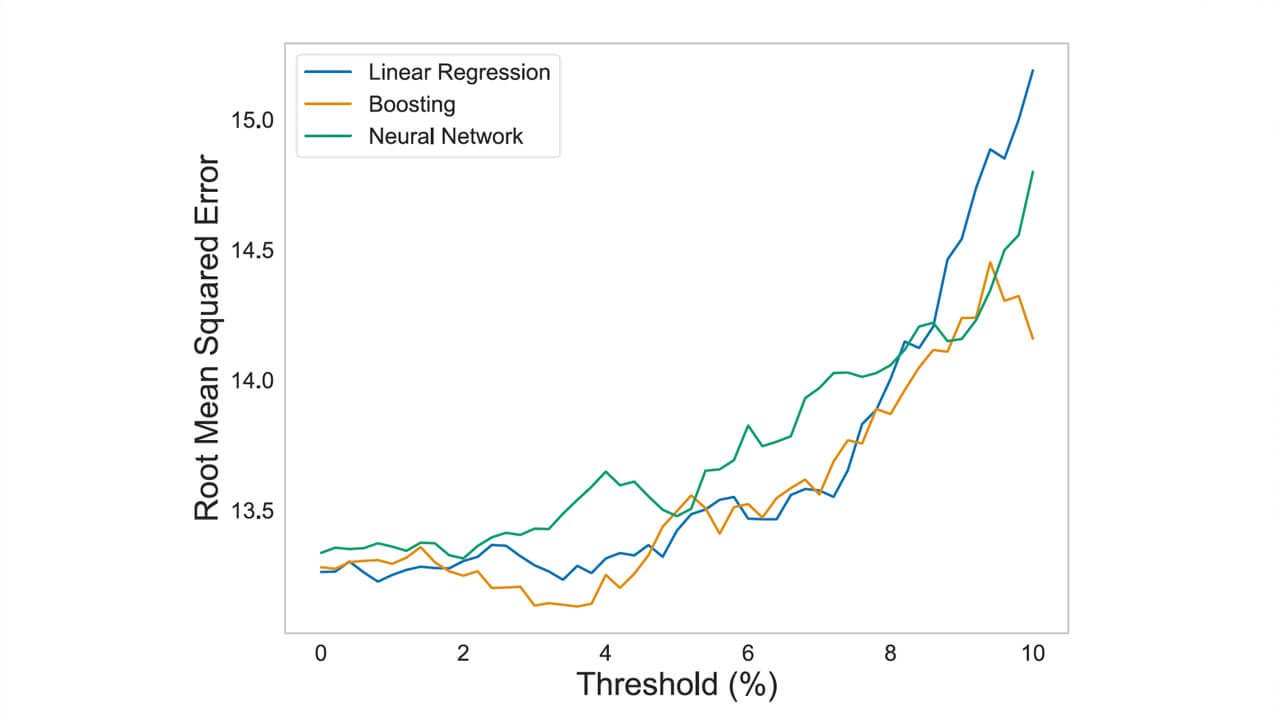
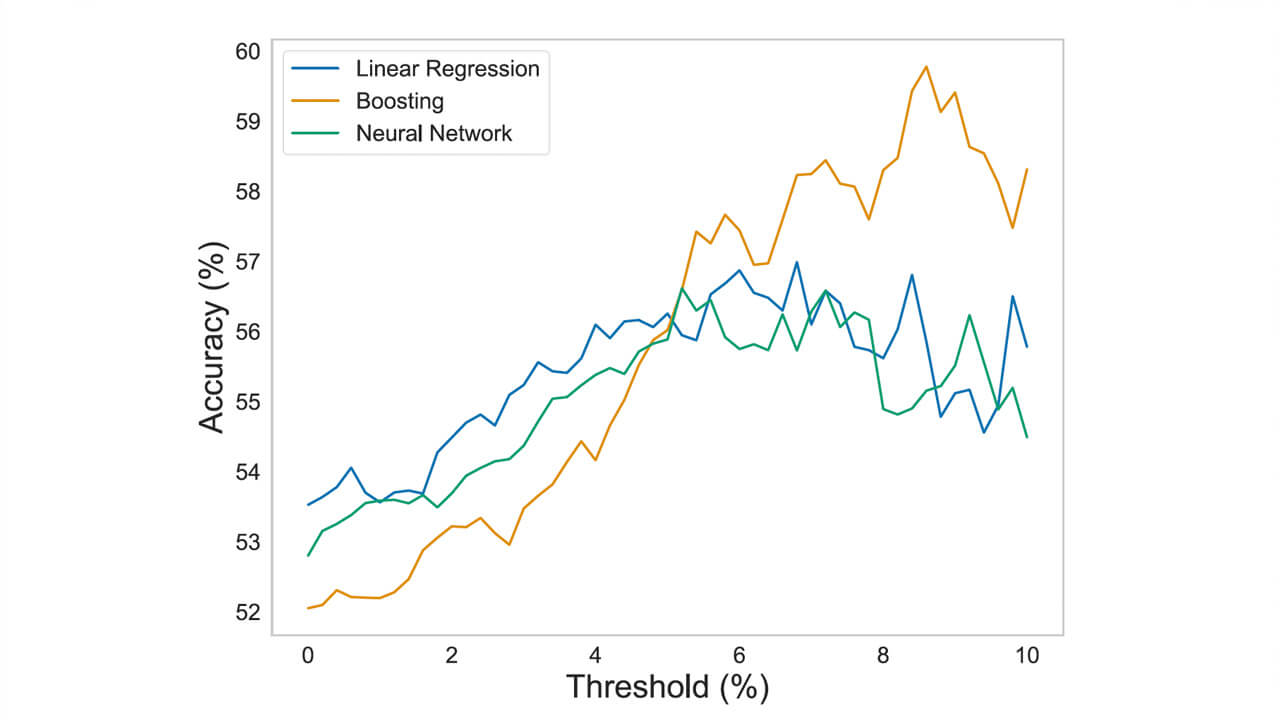
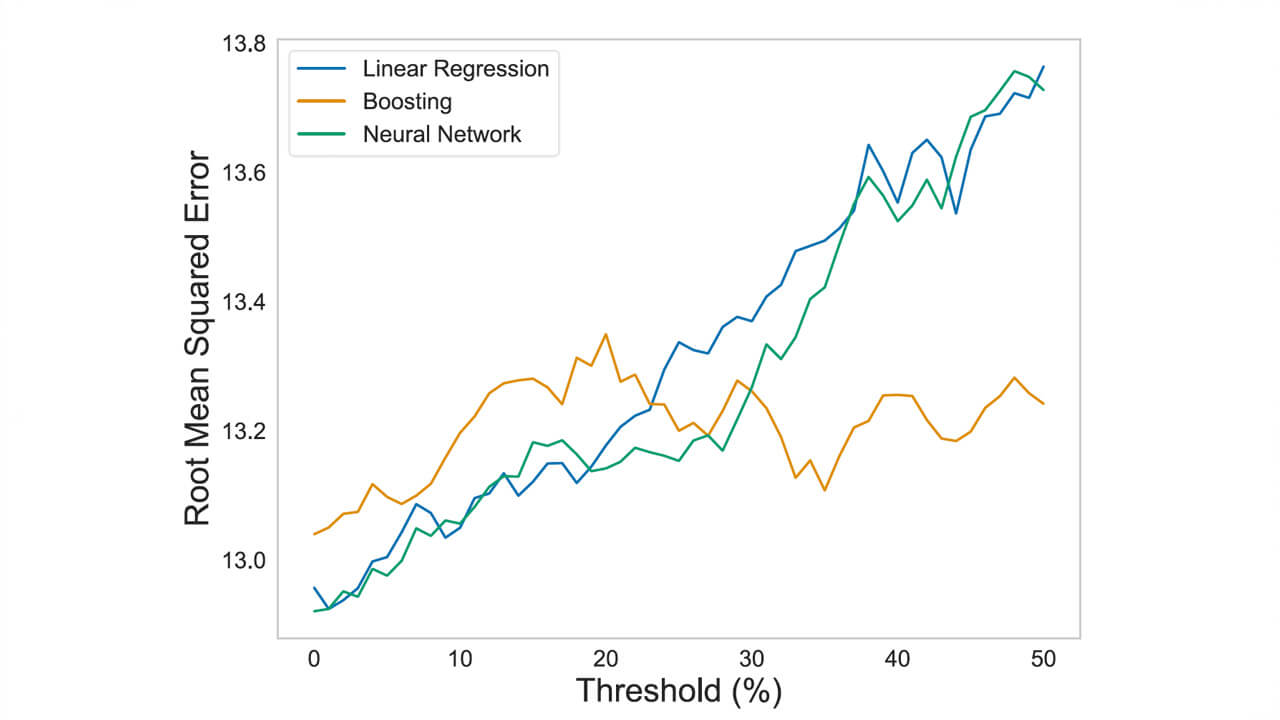
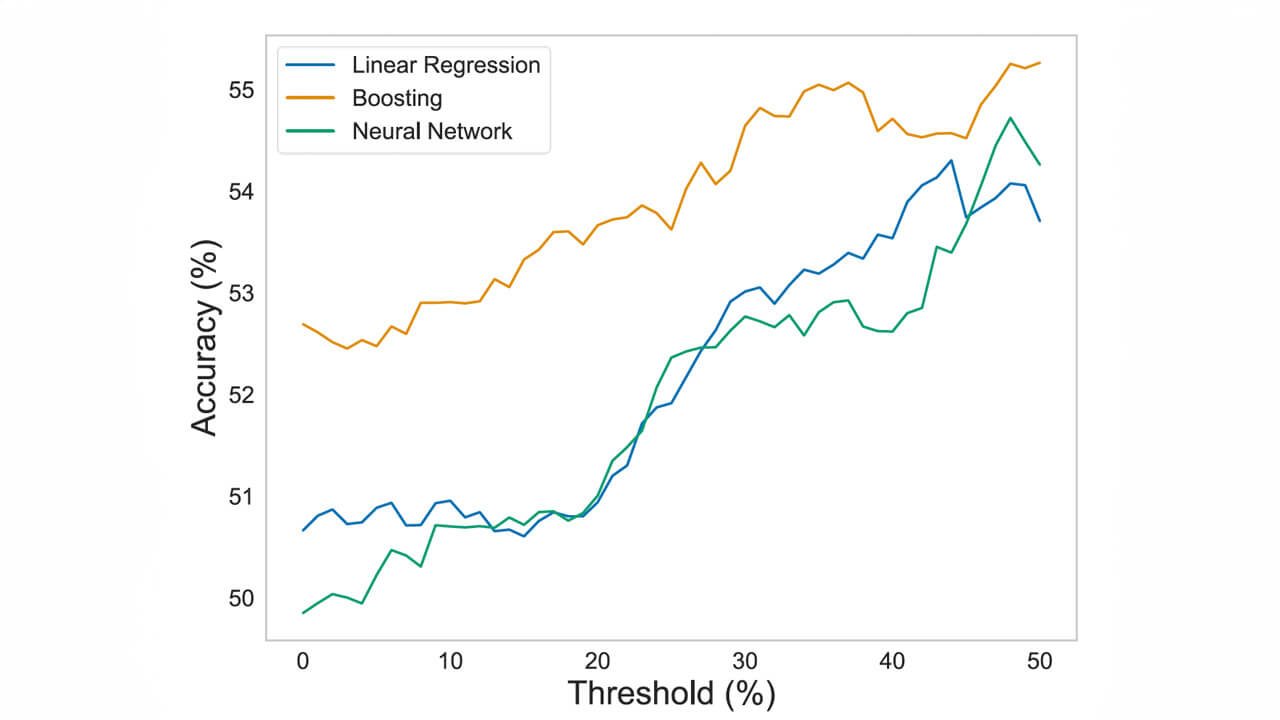
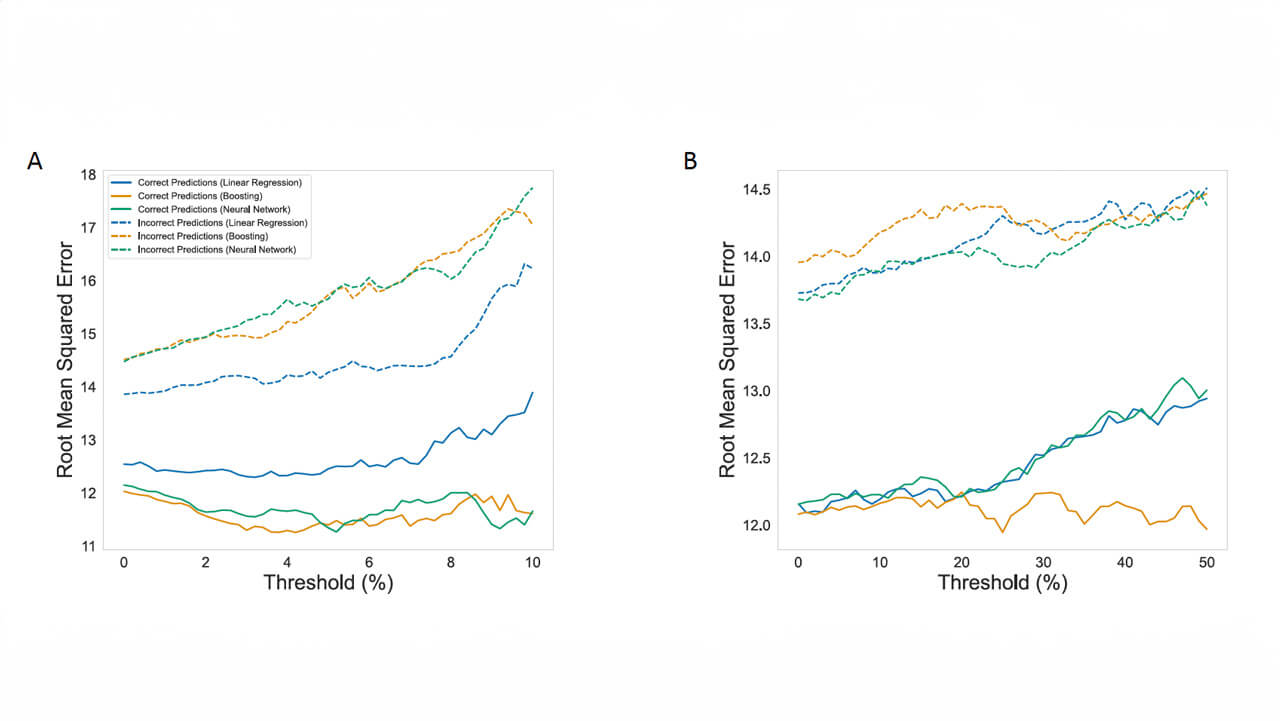
Models were fit to the data using three different techniques: linear regression, gradient boosting regression, and feedforward neural networks. The models were trained using predictor variables selected through a forward-selection process, a lasso-selection process, and a set of all predictor variables. This resulted in a total of nine unique combinations for both the total score and the spread. Thresholds were applied to these models to only predict games where the projected outcomes deviated by a specified percentage from the over/under and spread lines established by sportsbooks.
Table 1 illustrates the results of the total score models. Only linear regression and gradient boosting regression models demonstrated a root mean squared error better than that of sportsbooks, which was 13.22. However, all models obtained profitable classification accuracy for at least one threshold.
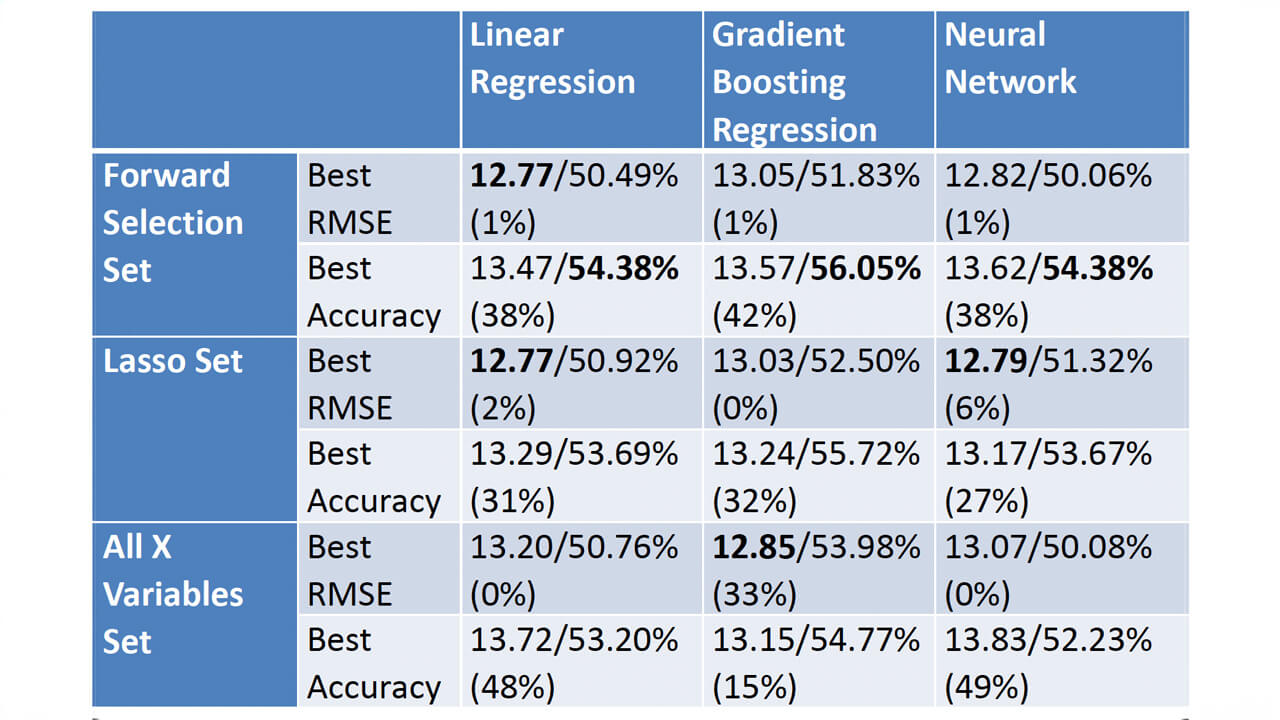
Table 2 illustrates the results of the total score models. Only a few models demonstrated a root mean squared error better than that of sportsbooks, which was 12.87. However, all models except the neural network trained on the set of all variables obtained profitable classification accuracy for at least one threshold.
"This project will help me in the future as I work to build my own website where I will license my NFL sports betting predictions. Additionally, it will serve as proof of competence in the data science field when I eventually transition professions from software development to data science." - Jacob Conrad ’24
This serves as an overview of the project and does not include the complete work. To further discuss this project, please email Jacob Conrad.
DS 480: Data Science Capstone serves as a culminating experience for the data science major. Students work on an independent project that will allow them to integrate knowledge from their previous courses in the major and apply that knowledge to a problem in a domain of their interest.
We've sorted each of our undergraduate, graduate and doctoral programs into unique Areas of Interest. Explore these categories to discover which programs and delivery methods best align with your educational and career goals.